Week 8, Create a photo still of a scene from a book.
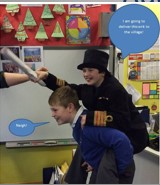 Can you recreate a scene from a book and take a photo of it? You could use toys, cardboard cut-outs or even willing family members! Can you add captions or speech bubbles?
Instructions and examples are attached below.
Download
 Here are the resources for today's task, as explained in the session. The instructions for the feelings graph and the explanation sentences are attached, as well as the bank of feelings adjectives we referred to in the session. There are also examples to help you. A blank feelings graph is attached separately for you to complete.
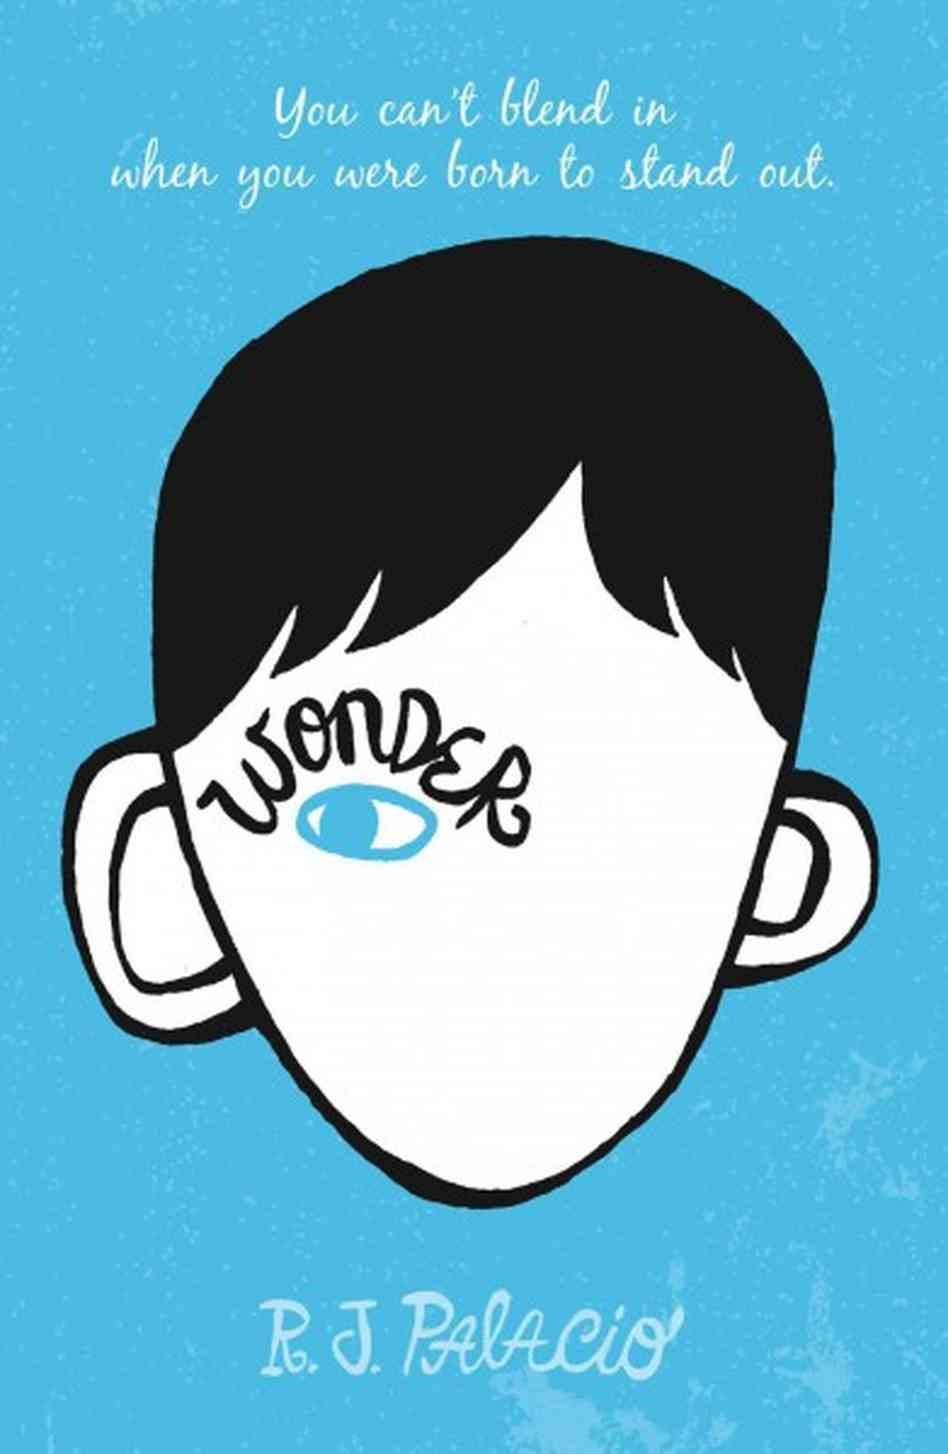
 Here are Chapters 29-31 of Wonder - Costumes, The Bleeding Scream, Names.